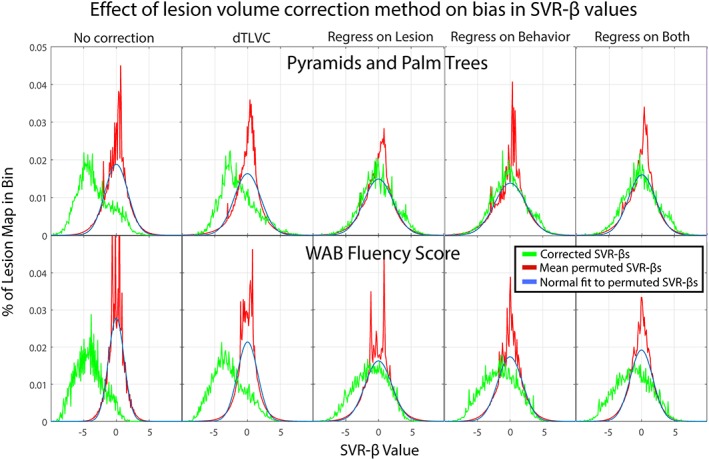
Figure 5.

Histograms of uncorrected SVR‐β values after five lesion volume correction methods (green) for two behaviors, including Pyramids and Palm Trees (top row) and WAB Fluency (bottom row). Also shown is the average histogram of 1,000 permuted SVR‐β maps for each behavior and correction method (red) and a normal distribution fit to the permutations, scaled to the histograms [Color figure can be viewed at http://wileyonlinelibrary.com]
