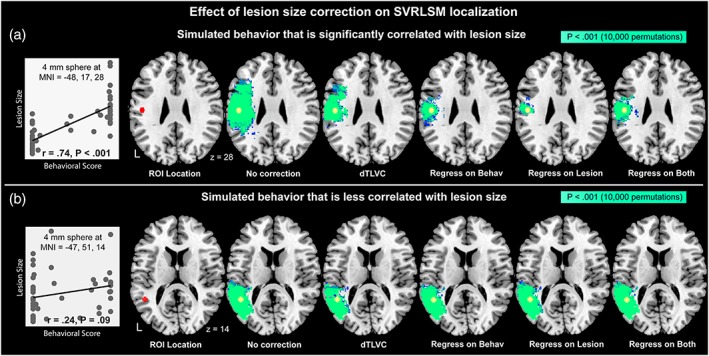
Figure 6.

Effect of lesion volume correction on SVR‐LSM localization for (a) a simulated behavior significantly correlated with lesion volume and (b) a simulated behavior less correlated with lesion volume. Behaviors were simulated by summing the number of lesioned voxels within a 4 mm sphere (red) placed based on its correlation with lesion volume. At the left of each pane is shown a scatterplot of lesion volume versus the simulated behavior across the patient sample. Voxels with statistically significant results at voxelwise p < .001 based on 10,000 permutations are shown in bright green [Color figure can be viewed at http://wileyonlinelibrary.com]
