Figure 2.
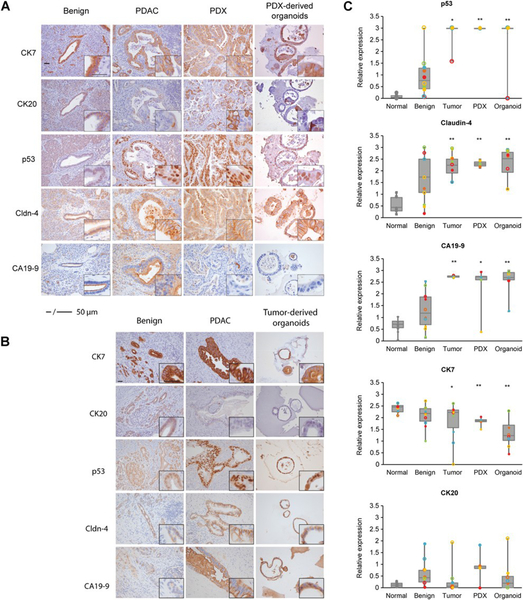
Patient and PDX-derived organoids share protein expression features with the primary tumor. Representative IHC staining patterns of p53, Claudin-4, CA19-9, CK7, and CK20 of primary PDAC, PDX, and PDX-derived organoid models (patients 1–5; A), and patient-derived organoids (patients 6–10; B). Results are representative of five independent fields. Imaging at 20x and 40x (scale bar, 50mm). C, p53, Claudin-4, CA19-9, CK7, and CK20 protein levels from normal and adjacent benign pancreas, primary tumor, PDX, and organoids were quantified. Expression was calculated by quantifying pixel intensity of 5 different fields per patient (n ¼ 10, individual patients reflected by color, filled shapes are PDX-derived, and empty shapes are tumor-derived groups).The median is indicated. Statistical analysis overall compared with benign tissue, *, P < 0.05; **, P < 0.01.

