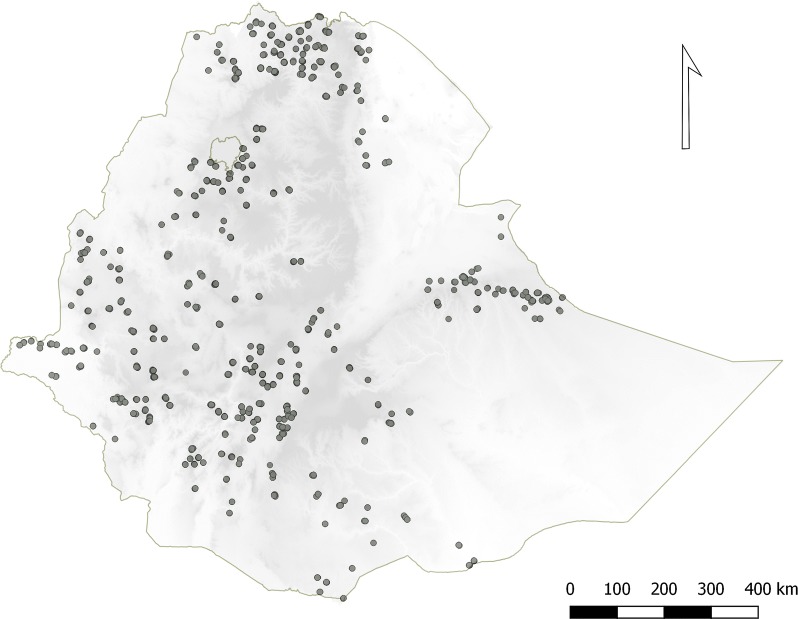
Fig. 2.
Distribution of dried blood spot (DBS) samples collected from selected malaria endemic areas of Ethiopia as part of the national, cross-sectional, household Malaria Indicator Survey conducted in 2015 (EMIS-2015). Each point depicts a cluster of sampled households in an EA. Shading indicates elevation which ranges from − 131 m below sea level (lightest) to 4092 m (darkest)

