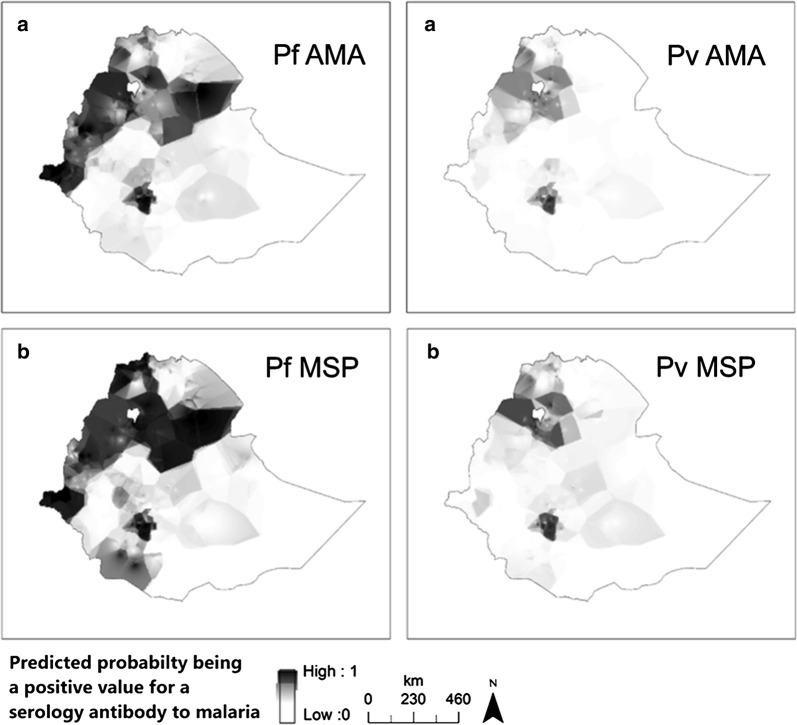
Fig. 5.
An interpolated surface map for Plasmodium falciparum antigen responses [a Apical Membrane Antigen-1 (AMA-1) and b Merozoite Surface Protein-1 (MSP-1)] and Plasmodium vivax antigen responses (a AMA-1 and b MSP-1). Darker colour shows high probability of being above the cut-off for seropositivity and lighter colour lower. Empirical bayesian kriging was used to produce the maps from serology data from samples collected during Ethiopian Malaria Indicator Survey (EMIS 2015)

