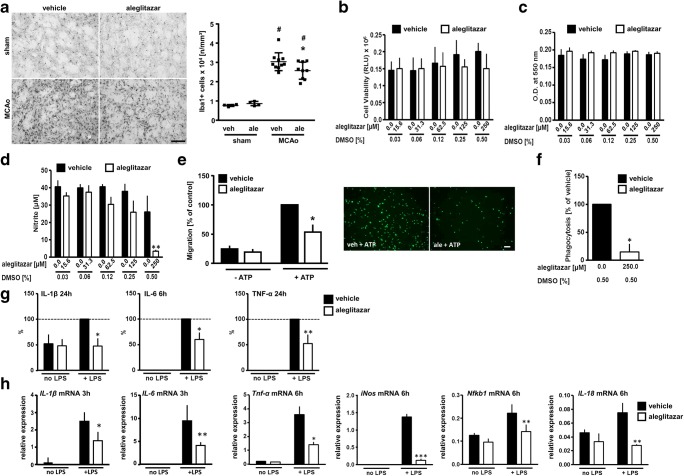
Fig. 2.
Aleglitazar and microglial behavior. a Density of Iba1-immunoreactive microglia/macrophages in the ischemic lesion at 7 days after MCAo/reperfusion. The corresponding area of sham-operated mice served as control tissue. Treatment with daily aleglitazar (3 mg/kg) was begun on the day of MCAo. N = 4–10 mice per group. Two-way ANOVA followed by Tukey’s multiple comparison test. #p < 0.01 MCAo vs. sham within each treatment condition. *p < 0.05 relative to vehicle-treated MCAo animals. b, c Aleglitazar was applied for 48 h. Viability of primary postnatal mouse microglia was assessed using a luminescent cytotoxicity assay (b) and the MTT dye assay (c). At the concentrations employed, aleglitazar did not affect cell viability. d LPS was applied at a concentration of 1 μg/ml for 48 h. NO release from microglia was quantified as nitrite accumulation. e Cell migration in a modified Boyden chamber chemotaxis assay was measured over a time period of 4 h. Aleglitazar significantly reduced migration stimulated by ATP. Scale bar 200 μm. f Phagocytosis was measured based on the uptake of bacterial particles conjugated to pH-sensitive dye over a span of 2 h. g Release of IL-1β, IL-6, and TNF-α was measured after 6 h or 24 h incubation with LPS (1 μg/ml). h mRNA expression of key genes associated with classical microglia activation after 3 h or 6 h incubation with LPS. Data in e–g were normalized due to variation between different experiments. Two-way ANOVA followed by Tukey’s multiple comparison test (b–e, g, h); unpaired Student’s t test (f). *p < 0.05, **p < 0.01, ***p < 0.005 relative to vehicle (DMSO), minimum of three independent measurements per data point. RLU relative light units

