Fig. 5.
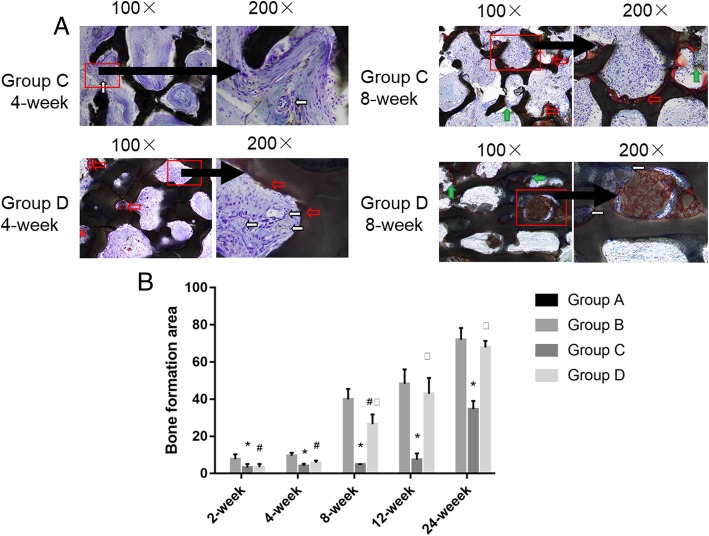
Van Gieson staining of C than D groups at × 100 and × 200 magnification and histogram of bone formation comparison of four groups. a Group C at the 4th week: more blood vessels and fibrous tissue grew into the material, and the new bone tissue was found in the pores (red arrow) (LM × 100). Group C at the 4th week: more blood vessels (white arrow) and fibrous tissue grew into the material, and the new bone tissue was found in the pores (red arrow), no bone formation (LM × 200). Group D at the 4th week: more blood vessels and fibrous tissue grew into the material, and the new bone tissue was found in the pores (red arrow) (LM × 100). Group D at the 4th week: more blood vessels (white arrow) and fibrous tissue grew into the material, and the new bone tissue was found in the pores (red arrow) (LM × 200). Group C at the 8th week: the collagen was formed on the surface of the material (green arrow), red stain osteoid like tissue on the surface of the material (red arrow) (LM × 100). Group C at the 8th week: the collagen was formed on the surface of the material (green arrow), red stain osteoid like tissue on the surface of the material (red arrow) (LM × 200). Group D at the 8th week: the new bone increased gradually from the two ends of the defect into the material, and there was a red staining of bone tissue (green arrow) (LM × 100). Group D at the 8th week: osteoblast cell was large and dark color, the core of the mesenchymal cell is shallow, has multiple projections, and is along the edge of the material distribution (white arrow) (LM × 200). b Histogram of bone formation comparison of four groups. *P value < 0.05, group C compared with group B. #P value < 0.05, group D compared with group B. □P value < 0.05, group C compared with group D

