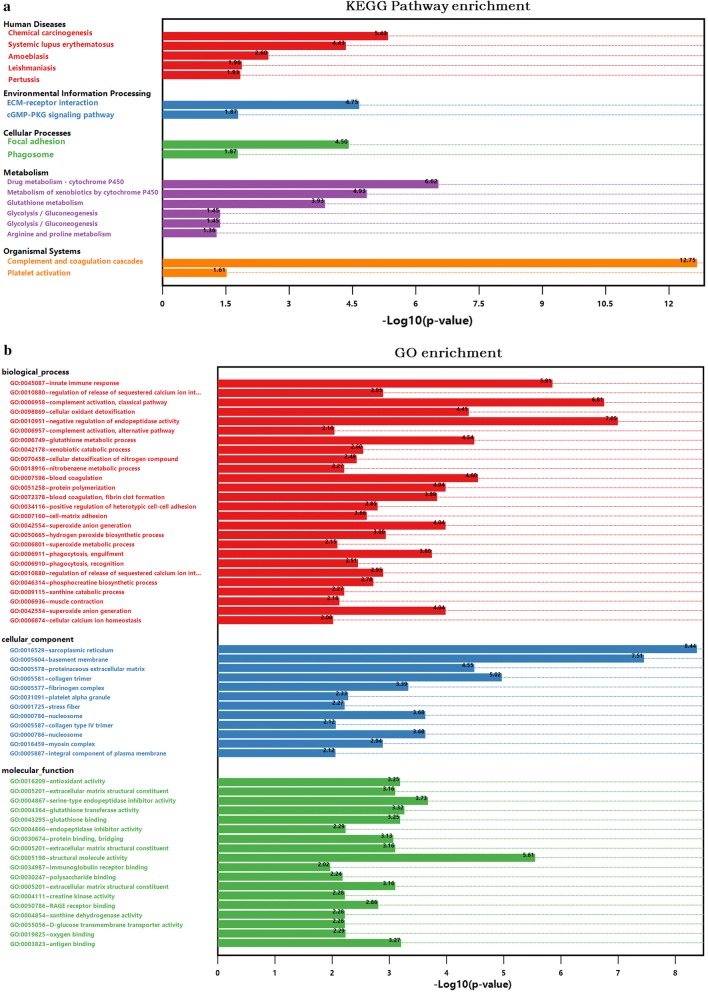
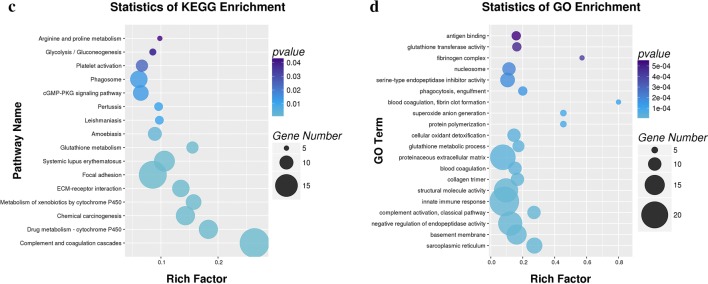
Fig. 3.
Functional classifications based on pathway enrichment analysis of differentially expressed proteins in the hypoxic group compared with the control group. a The KEGG pathway classification of DEPs (p < 0.05). b GO functional classification of DEPs (p < 0.01). c, d Rich factor of significant KEGG pathways and GO terms


