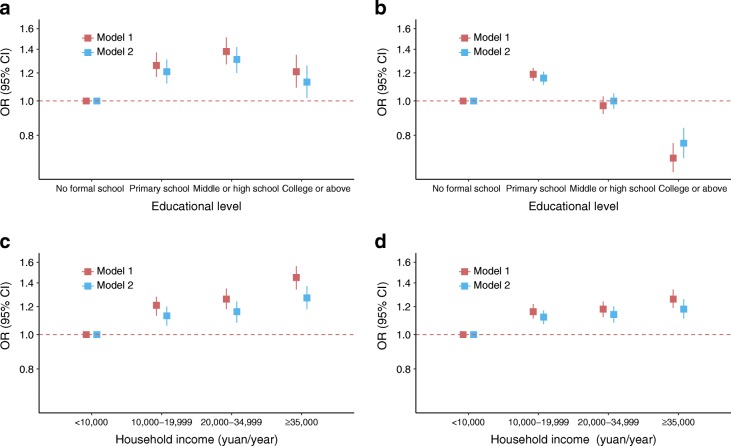
Fig. 1.
Adjusted ORs and 95% CIs for prevalent diabetes associated with educational level (a, b) and household income (c, d) in men (a, c) and women (b, d), plotted on a logarithmic scale. For educational level, model 1 was adjusted for age at baseline (continuous), study region, family history of diabetes and household income. Model 2 was further adjusted for BMI based on model 1. For household income, model 1 was adjusted for age at baseline (continuous), study region, family history of diabetes, educational level and household size. Model 2 was further adjusted for BMI based on model 1. See ESM Tables 3 and 4 for data

