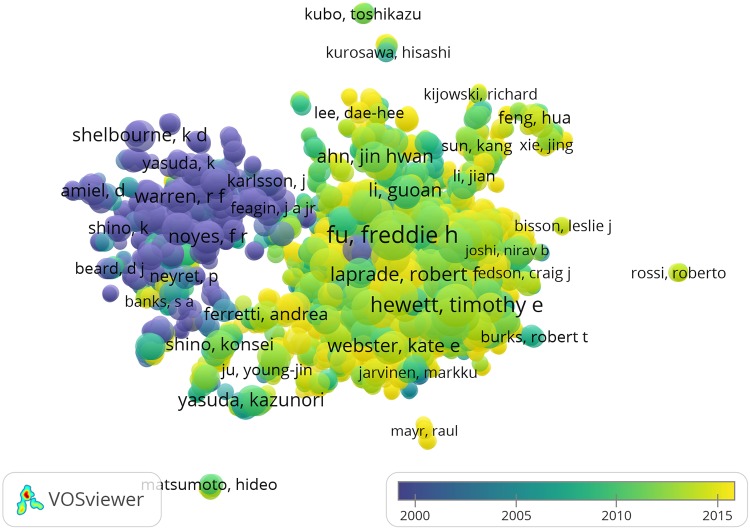
Figure 5.
VOSviewer output for all authors. The more prominent and more significant the author, the bigger the circle; and the more frequent the occurrence of the name, the greater number of publications. Color coding indicates that the publications were more frequent around 2010 and between 2010 and 2015, and color coding of the linked author indicates the predominant year of the link.

