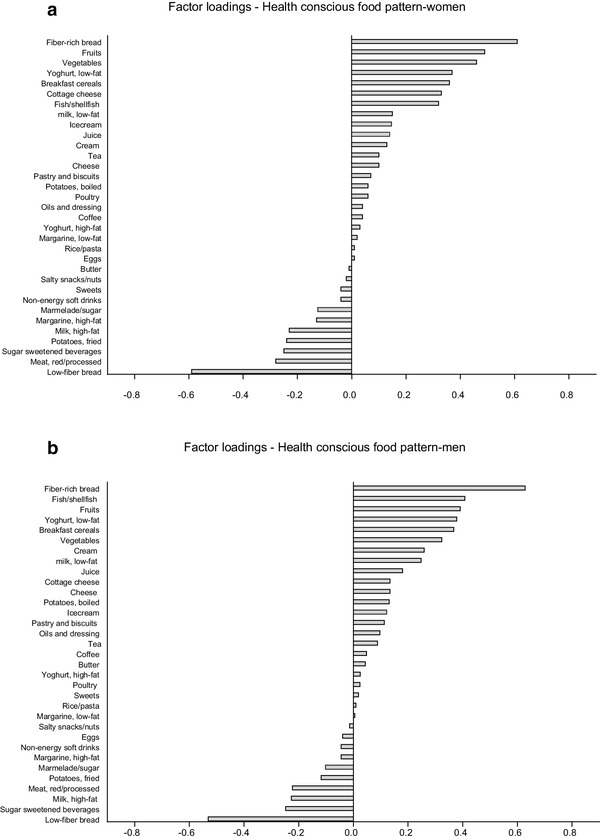
Fig. 1.

a The food pattern that explained most of the variance in women (7%). b The food pattern that explained most of the variance in men (7%)

a The food pattern that explained most of the variance in women (7%). b The food pattern that explained most of the variance in men (7%)