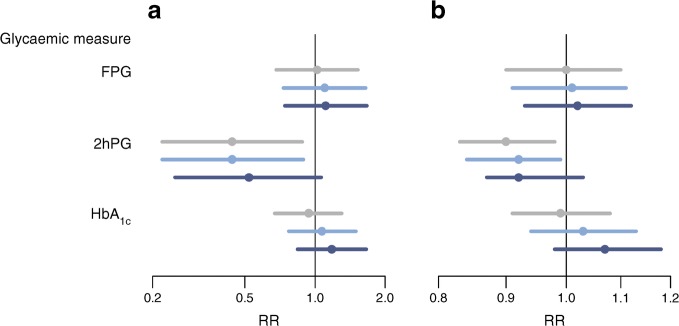
Fig. 1.
Rate ratios (RRs) of an event (CVD or death) for reverting from prediabetes to normoglycaemia vs not reverting (a) or for decreasing 1 SD in glycaemic measure over 5 years from phase 7 to phase 9 (b). Grey: unadjusted RR; light blue: adjusting for age and sex; dark blue: further adjusting for previous CVD. The RR for 1 SD decrease (b) is further adjusted for baseline glycaemia in all the analyses. The x-axis is on a natural logarithmic scale

