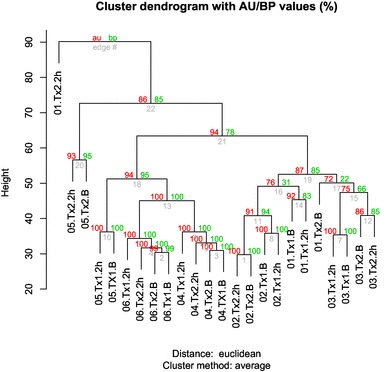
Fig. 5.

Cluster analysis of samples. Dendrogram of unsupervised hierarchical clustering on normalized gene expression values show a good agreement of samples according to their classification. Labels are defined as follows: subject ID {01:06}, treatment {Tx1: cocoa, Tx2: placebo} and condition {B: baseline and 2 h: after 2 h}. Clustering performed with Spearman correlation, Euclidean distance and average linkage. Numbers in red represents AU (approximately unbiased) p values (%). Numbers in green represents BP (bootstrap probability)
