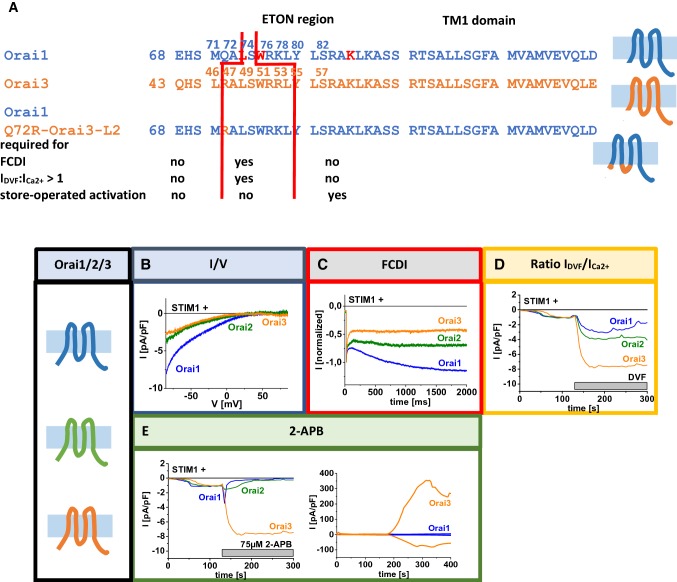
Fig. 5.
Isoform-specific differences in the CRAC channel hallmarks. (A) Sequence alignement of Orai1, Orai3 and Orai1 Q72R Orai3–L2 of the ETON and TM1 region. Red lines mark the parts of the ETON region required for maintenance of store-operated activation, FCDI and a ratio of IDVF:ICa2+ > 1. (B–D) Comparison of the authentic CRAC channel hallmarks, Vrev, FCDI, ratio of IDVF:ICa2+ and effects of 2-APB on Orai1, Orai2 and Orai3.
Graphs adapted from Derler et al. (2009b, 2013b), Fahrner et al. (2018a), Frischauf et al. (2009), and Lis et al. (2007)

