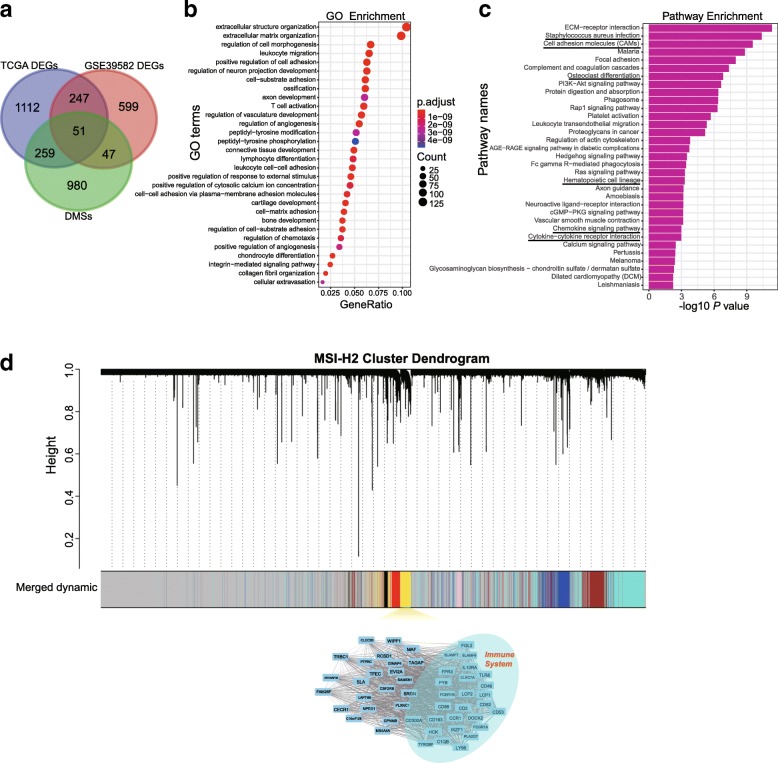
Fig. 2.
Characterization of functional enrichment of DEGs reside in the MSI-H subtypes. a, Venn diagram displaying the number of genes that overlapped within DEGs and DMSs identified in TCGA and GSE39582 datasets. b, GO enrichment of up-regulated DEGs found in MSI-H1. c, KEGG pathway enrichment of up-regulated DEGs found in MSI-H1. d, Coexpression regulatory network identified by WGCNA. Genes that were not coexpressed were assigned to the gray group. Each vertical line corresponds to a gene, and branches are expression modules of highly interconnected groups of genes. In total, seven modules ranging from 146 to 2,939 genes in size were identified in MSI-H2. The yellow module associated with the immune response was selected for visualization

