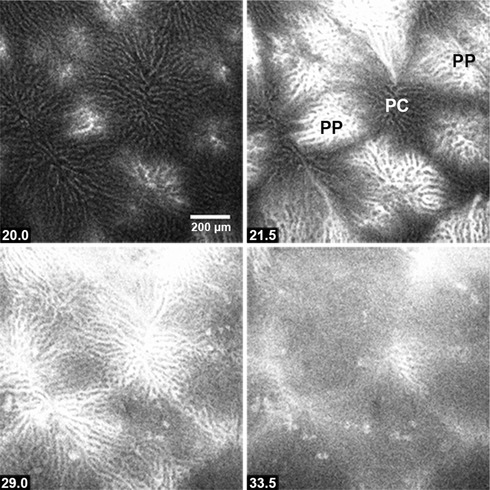
Figure 1. Determination of hepatic lobular zones.

Fluorescein‐conjugated BSA (100–300 μL of 10 mg mL–1 stock) was injected into the perfusion line entering the portal vein prior to the termination of each experiment (see Methods). Periportal (PP) zones were identified as sites where the fluorescence intensity initial increases, whereas pericentral regions (PC) are located where the fluorescein subsequently appears. Time points (s) are shown at the bottom left. The figure corresponds to Movie S1 in the Supporting information.
