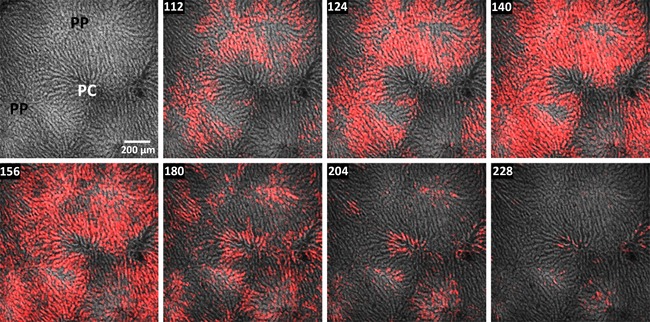
Figure 2. Intercellular [Ca2+]c waves induced by vasopressin.

Fura‐2/AM loaded rat liver was perfused with 40 pm vasopressin starting at 68 s. Multiphoton confocal images of fura2 fluorescence are depicted in a linear grey scale and the hormone‐induced [Ca2+]c increases with a red overlay (see Methods). The images show a spatially organized intercellular wave initiated from the periportal region (PP) and propagating into the pericentral zone (PC). The figure corresponds to Movie S2 in the Supporting information. Time points (s) are shown at the top left.
