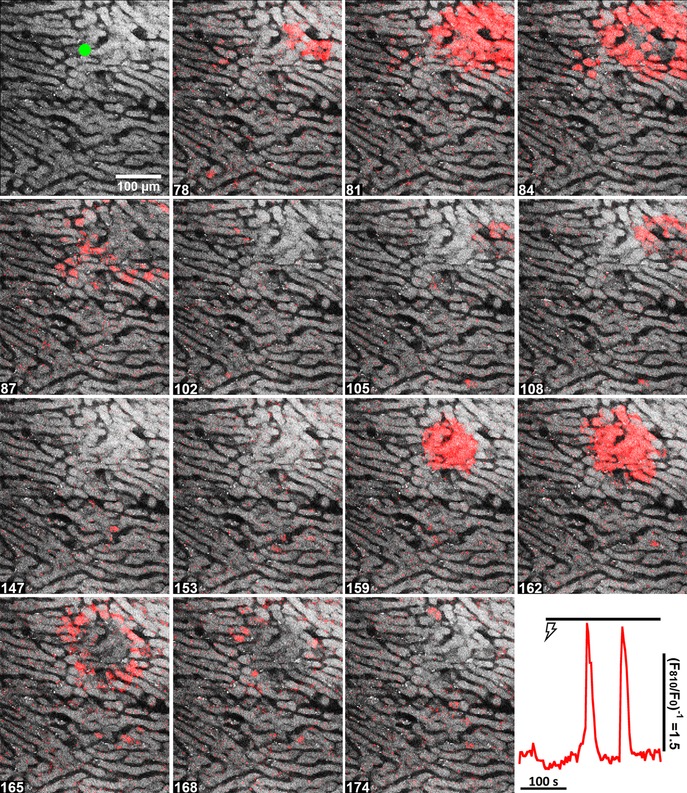
Figure 4. Repetitive localized intercellular Ca2+ waves elicited during continuous electrical stimulation of an intact perfused liver.

Hepatic nerve fibres were stimulated for 5 min at 4 V and 6 Hz starting at 60 s. The figure corresponds to Movie S4 in the Supporting information. Time points (s) are shown at the bottom left. The trace (bottom right) shows the Ca2+ increases induced by electrical stimulation ( ) in the single hepatocyte highlighted by the green ROI in the top left panel.
