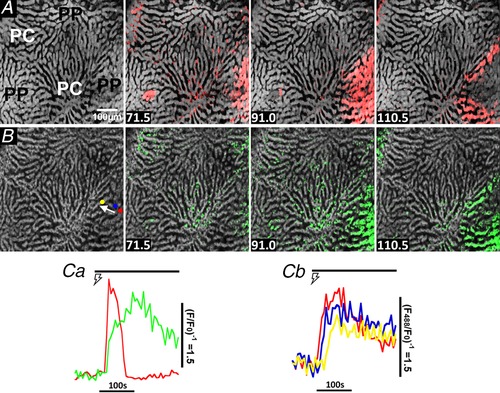
Figure 5. Electrically‐evoked [Ca2+]c and mitochondrial flavoprotein responses in the intact perfused liver.

Fura‐2/AM loaded liver was sequentially illuminated with 810 nm and 488 nm excitation to monitor cytosolic Ca2+ (A, upper row of images) and the redox state of mitochondrial flavoproteins (B, lower row of images), respectively. Hepatic nerve fibres were stimulated for 5 min at 4 V and 10 Hz starting at 33 s, which induced a periportal (PP) Ca2+ wave (red overlay) that was followed by a reduction in mitochondrial flavoproteins (green overlay). Time points (s) are shown at the bottom left. Ca, single cell trace of an electrically‐induced ( ) Ca2+ spike (red) and corresponding reduction in mitochondrial flavoproteins (green). Cb, traces are electrically‐induced mitochondrial flavoprotein responses in three hepatocytes highlighted by the coloured regions of interest shown in (B) and chosen to be in‐line with the Ca2+ wave propagation pathway (white arrow).
