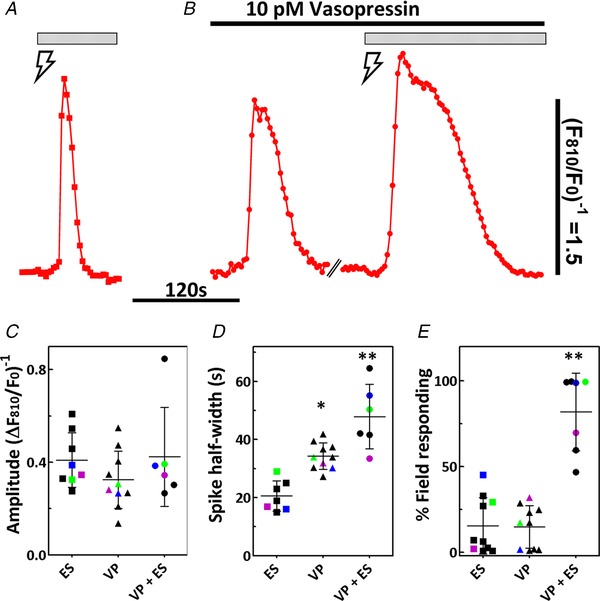
Figure 8. Summary of Ca2+‐responses induced by electrical and hormonal stimuli in the perfused liver.

A and B, Stimulus‐induced Ca2+ spikes from experiments shown in Figs 4 and 6 were aligned to the rising phase of the Ca2+ transient. Traces are averaged Ca2+ transients induced by (A) electrical stimulation ( ) or (B) vasopressin stimulation followed by vasopressin plus electrical stimulation (
 ); n = 16–41 cells per condition. Bars above traces indicate the duration of the stimulus and broken line indicates a gap in time series. Summary data showing (C) Ca2+ spike amplitude and (D) spike width calculated at half‐height. Ca2+ spikes were induced by electrical stimulation (ES; 4 V, 4 Hz), perfusion with 10 pm vasopressin (VP) or vasopressin plus electrical stimulation (VP + ES). E, percentage of the field responding with an increase in [Ca2+]c that occurred within 5 min after commencing the indicated stimulus. Scatter plots are the mean ± SD with each symbol representing data from a separate liver, n = 6–10 liver preparations and 150–300 hepatocytes analysed per stimulus. The blue, green and purple symbols show data from the same liver preparation put through all three sequential stimuli. *Significantly different compared to ES, **Significantly different compared to ES or VP; P < 0.05; one‐way ANOVA with a post hoc Bonferroni test.
