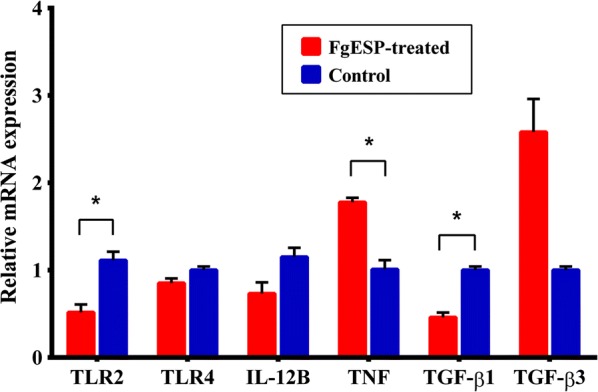
Fig. 6.

Changes in mRNA expression of TLR2, TLR4 and key cytokines in DCs treated with FgESPs. The x-axis represents the names of genes and the y-axis represents the relative mRNA expression of target genes. Expression is relative to the buffalo GAPDH gene based on the 2−ΔΔCq calculation. Red bars represent the FgESPs-treated group and blue bars represent the control group. Columns show the means and error bars show SEMs. Significant differences were compared to the control group. *P < 0.05, **P < 0.01 (Student’s t-test)
