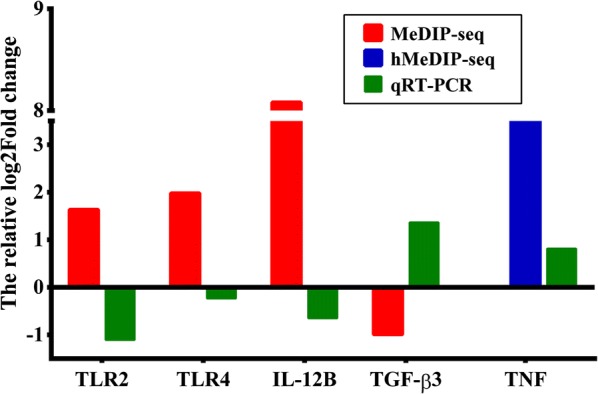
Fig. 7.

Comparative sketch of the relative fold changes between (h)MeDIP-seq and qRT-PCR. The relative fold change of (h)MeDIP-seq and qRT-PCR was calculated based on Log2. Red, blue and green bars represent MeDIP-seq, hMeDIP-seq and qRT-PCR analyses, respectively. The x-axis indicates the names of the genes and the y-axis represents the relative Log2 fold changes of the target genes. This figure indicates that the results obtained from qRT-PCR matched the prediction of the (h)MeDIP-seq analyses
