
Fig. 3.
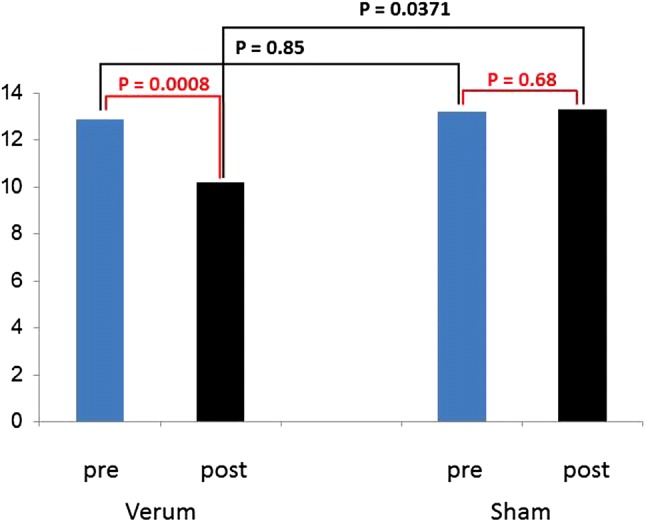
Post hoc tests: behaviour of HAM scores [all p values obtained by paired (red) or unpaired (black) Student’s t tests] in patients: the difference between pre- and post-treatment values is highly significant (p = 0.0008), while in controls there is practically no effect of treatment (p = 0.68). The difference between verum and sham pre-treatment values is not significant (p = 0.85); due to the significant treatment effect in patients, however, the post-treatment values differ between verum and sham (p = 0.0371)