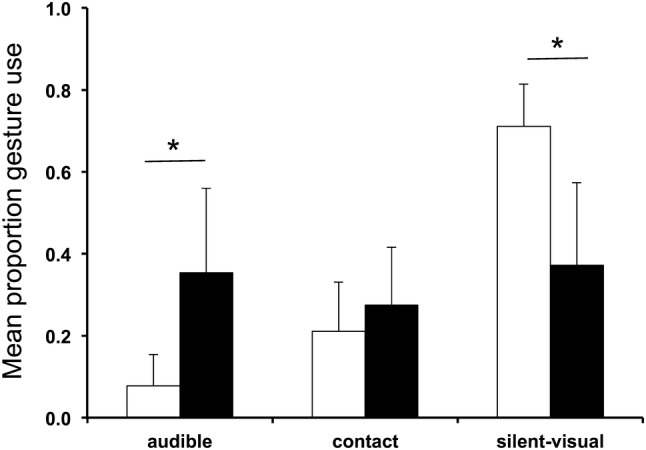
Fig. 2.

Comparison of the mean proportion of gesture use across modalities (audible, contact, and silent-visual) by chimpanzees and children. White bars represent children; black bars represent chimpanzees; error bars represent standard deviation. Planned t tests were used to explore differences between the use of modalities in the two species: *P < 0.0001
