Fig. 1.

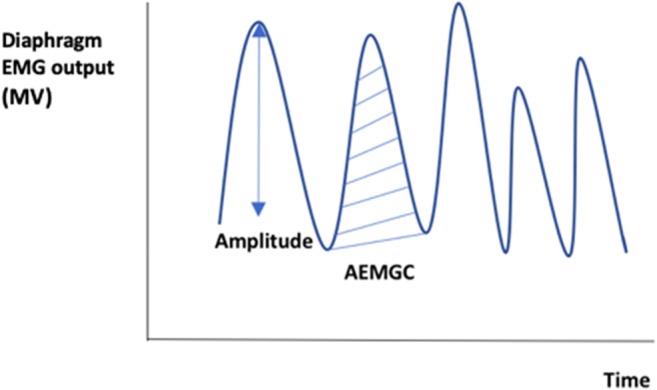
Representation of diaphragm EMG curve showing the amplitude (shown by the vertical line) and area under the curve (AEMGC) (shown by the hatched area)

Representation of diaphragm EMG curve showing the amplitude (shown by the vertical line) and area under the curve (AEMGC) (shown by the hatched area)