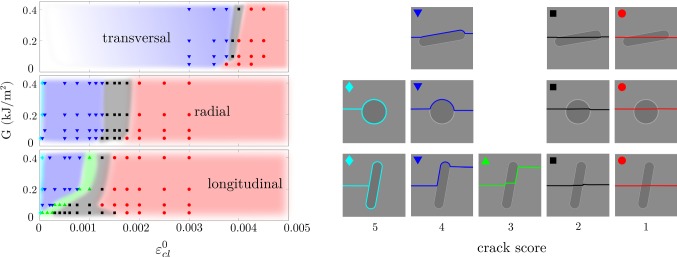
Fig. 4.
Crack score as a function of the strain energy release rate (G = Gmat = Gost = Gcl) and the critical interface strains (). Each point in the graph corresponds to a simulation, and colored regions are drawn to visualize the region of each crack score. Smaller variations were seen within all crack scores, and the depicted crack trajectories are given as examples for each group

