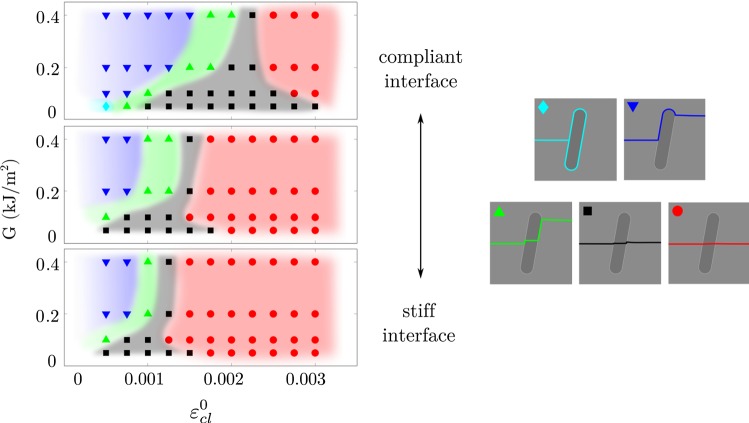
Fig. 5.
Effect of cement line stiffness in the longitudinal model, where the top plot corresponds to a compliant cement line (Ecl = 0.8·Eost = 9.6 GPa), the middle plot to a cement line with the same stiffness as the matrix (Ecl = Emat = 15 GPa) and the lower plot to a stiff cement line (Ecl = 1.2·Emat = 18 GPa, same as shown in Fig. 3). Each point in the graph corresponds to a simulation, and colored regions are drawn to visualize the region of each crack score, as shown in the right

