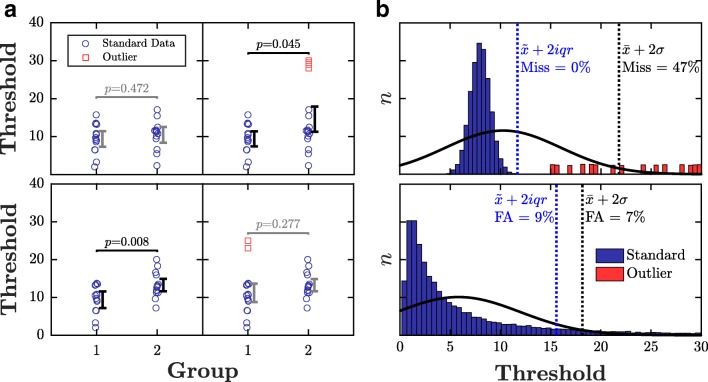
Fig. 1.
Example hypothetical data showing: a how the presence of statistical outliers (red squares) can qualitatively affect the overall pattern of results, and b common errors made by existing methods of outlier identification heuristics, including misses and false alarms (FA). P values in panel a pertain to the results of between-subject t tests

