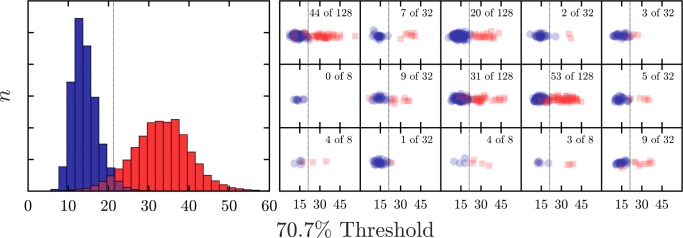
Fig. 3.
Data from simulated observers. (left) Sampling distributions for the 70.7% Threshold statistic, generated by simulation, using the psychometric functions in Fig. 2. (right) Example samples, with variable sample size 〈8,32,128〉 and proportion of non-compliant observers (0 to 50%). For every sample, each of the eight methods of outlier detection in Section 2 was applied, and its performance recorded. Dashed vertical line shows the ideal unbiased classifier, for which: hit rate = 0.97, false alarm rate = 0.05

