Fig. 1.
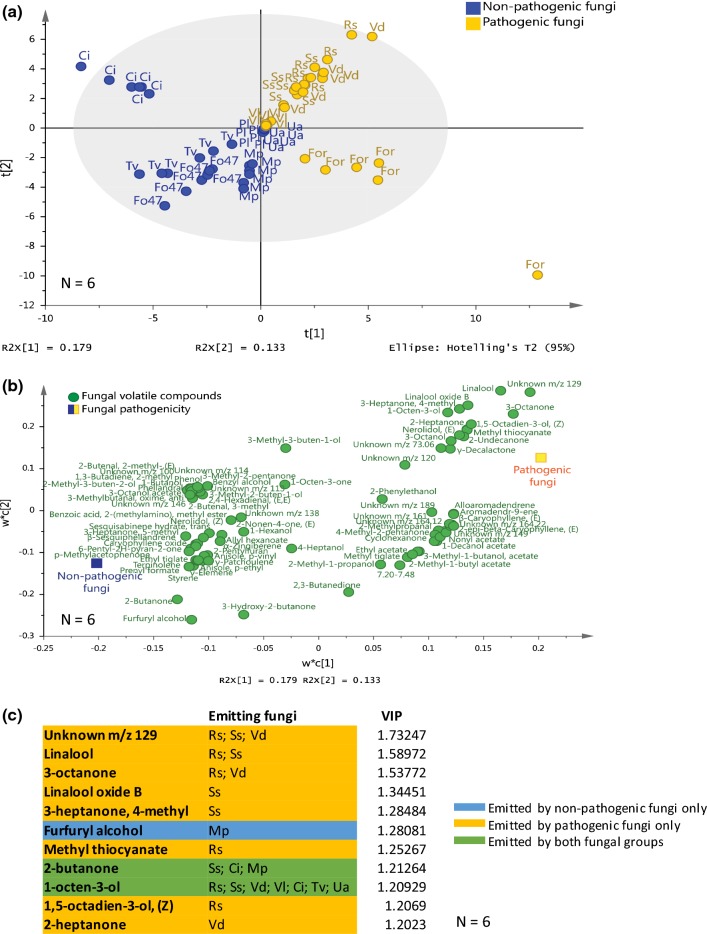
Projection to Latent Structures Discriminant Analysis (PLS-DA) of volatile organic compounds (VOCs) collected from the headspace of pathogenic and non-pathogenic fungi of Arabidopsis thaliana. a Grouping pattern of samples according to the first two principal components and the Hotelling’s T2 ellipse confining the confidence region (95%) of the score plot. b Contribution of individual VOCs to the first two principal components is shown in the loading plot of the PLS-DA. c List of VOCs with values of variable importance in projection (VIP) > 1.2. Different letters indicate the distribution of the samples of the 11 different fungi: Ci, Chaetomium indicum; Fo47, Fusarium oxysporum 47; For, F. oxysporum f.sp. raphani; Mp, Mucor plumbeus; Pl, Phoma leveillei; Rs, Rhizoctonia solani; Ss, Sclerotinia sclerotiorum; Tv, Trichoderma viride; Ua, Ulocladium atrum; Vd, Verticillium dahliae; Vl, Verticillium longisporum

