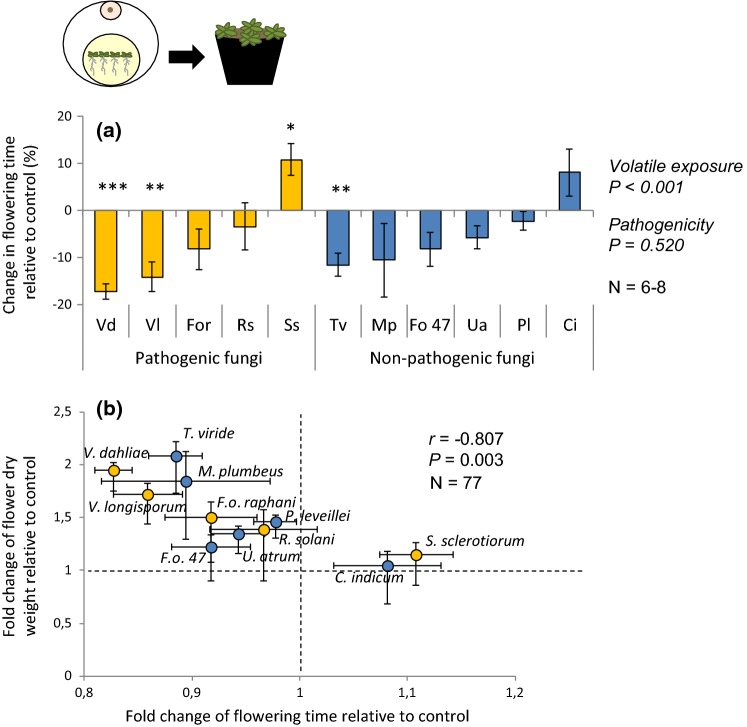
Fig. 4.
a Change in flowering time (mean % ± SE) of Arabidopsis thaliana exposed temporary to fungal volatiles in vitro, and subsequently grown in soil 2.5 weeks. b Pearson correlation between the fold change of flower dry weight (mean % ± SE) and flowering time (mean % ± SE) of A. thaliana exposed to the fungal volatiles relative to control. Ci, Chaetomium indicum; Fo47, Fusarium oxysporum 47; For, F. oxysporum f.sp. raphani; Mp, Mucor plumbeus; Pl, Phoma leveillei; Rs, Rhizoctonia solani; Ss, Sclerotinia sclerotiorum; Tv, Trichoderma viride; Ua, Ulocladium atrum; Vd, Verticillium dahliae; Vl, Verticillium longisporum. Main effect of the volatile exposure was tested using a one-sample Student’s t test (H0 = 0), and difference of flowering time in response to volatiles of different fungal pathogenicity was tested using two-sample Student’s t test at α = 0.05. Asterisks indicate statistical differences with the respective control plants (*P < 0.05; **P < 0.01; ***P < 0.001) using one-sample Student’s t test (H0 = 0). For the Pearson correlation, dash lines represent the control plants

