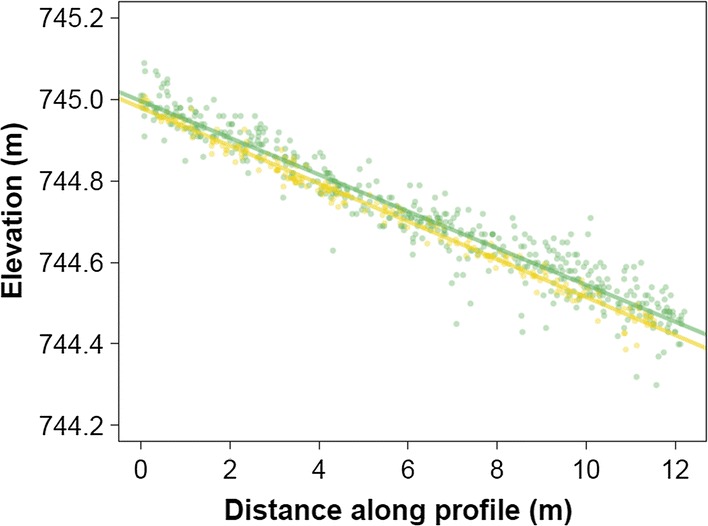
Fig. 4.

Comparison of lidar surface elevation profiles from April 16, 2018 (green points and line) and June 6, 2018 (orange points and line). The profile is 2 cm wide and was extracted from the stem of a fallen tree (labeled A in Fig. 3). The mean difference in elevation between these lines is 2.4 cm. The residual standard error is 4.5 cm in April and 2.1 cm in June
