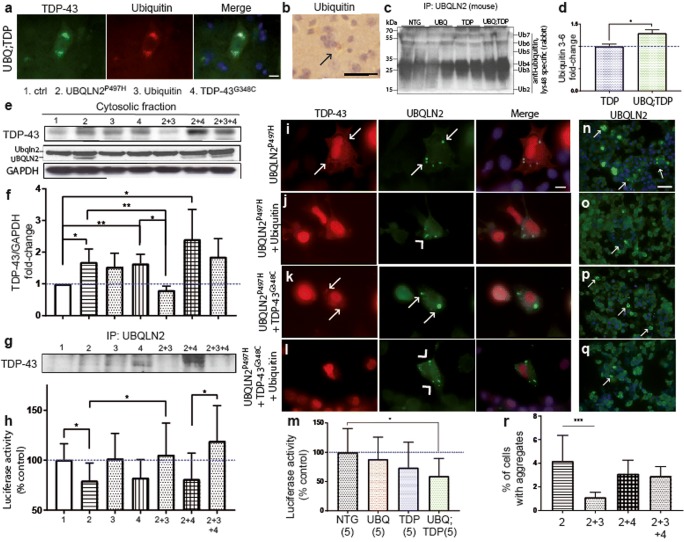
Fig. 7.
Reversal of UBQLN2-driven UPS dysfunction and TDP-43 aggregation by upregulation of ubiquitin. a TDP-43 and ubiquitin co-immunofluorescence in spinal cord of double-transgenic mice at × 100 magnification (scale bar =10 μm). b Ubiquitin immunohistochemistry from cortex of double-transgenic mice at 8 months of age at × 40 magnification (scale bar = 100 μm, black arrow = ubiquitin inclusion). c Immunoprecipitation of UBQLN2 from brain of transgenic mice at 8 months of age followed by SDS-PAGE and immunoblotting with Lys48-bound specific antibody (Ub ubiquitin 2–7) to detect co-immunoprecipitated ubiquitin chain. d Quantification of the ubiquitin 3, 4, 5, and 6 levels after immunoprecipitation of UBQLN2 from brain extracts of TDP-43G348C and UBQLN2P497H; TDP-43G348C mice. e TDP-43 and UBQLN2 detection by immunoblotting of cytoplasmic extracts from Neuro2A transfected cells 48 h after transfection with either control (1), pCMV-hUBQLN2P497H (2), pCMV-hTDP-43G348C (4), pCMV-ubiquitin (3), or a combination of these plasmids. f Quantification of the TDP-43 levels in the cytosolic fraction of the Neuro2A-transfected cells (n = 3). g Co-immunoprecipitation of TDP-43 with UBQLN2 extracts from Neuro2A-transfected cells. h Proteasome-glo chymotrypsin-like assay in the Neuro2A-transfected cells with either control, pCMV-hUBQLN2P497H, pCMV-hTDP-43G348C, pCMV-ubiquitin of a combination of these plasmids (n = 5). i–l TDP-43 and UBQLN2 co-immunofluorescence in Neuro2A-transfected cells at × 100 magnification (arrow head = TDP-43 negative inclusions, arrow = TDP-43 positive inclusions) (scale bar = 10 μm). m Proteasome-glo chymotrypsin-like assay with spinal cord extracts from transgenic mice (n = 5). n–q UBQLN2 immunofluorescence of Neuro2A-transfected cells 48 h after transfection with same combination of plasmids (white arrow = UBQLN2 aggregates). Pictures were taken at × 40 magnification (scale bar = 50 μm). r Percentage of cells with aggregates. Pictures were taken on six fields per group and total number of cells were count with Dapi staining

