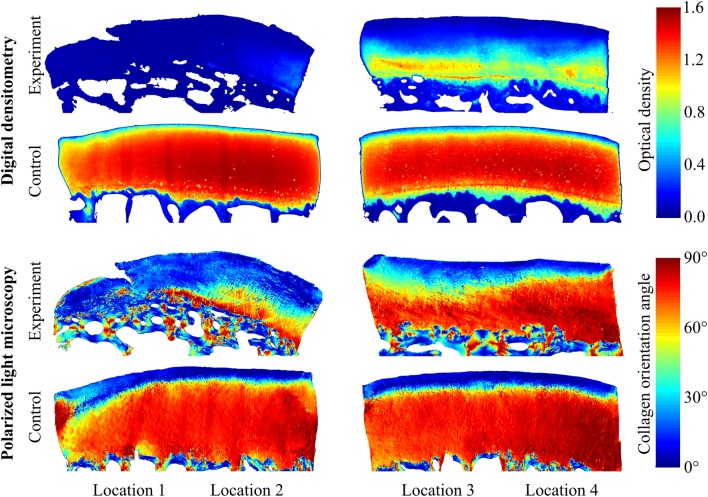
Figure 2.
Example digital densitometry (optical density, i.e., proteoglycan content) and polarized light microscopy (collagen orientation angle) images of the experiment (worst case) and control (best case) groups from matching anatomical sites (distal locations 1-4). The arthroscopic photo shown as an inset in Fig. 1b was recorded during NIRS acquisition of the worst case at Distal location 3.

