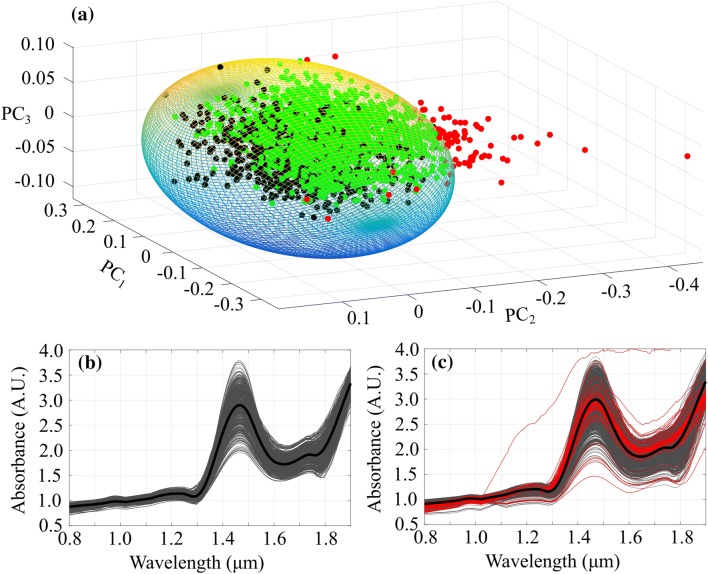
Figure 3.
Minimum volume ellipsoid (MVE, a) calculated from the scores of in vitro (black) NIR spectral measurements. In addition, scores of in vivo spectral measurements within the MVE are presented (green) along with the outliers (red). In addition, smoothed in vitro (b) and in vivo (c) spectra with average spectra (black) are presented. In subfigure (c), outlier spectra are shown in red.

