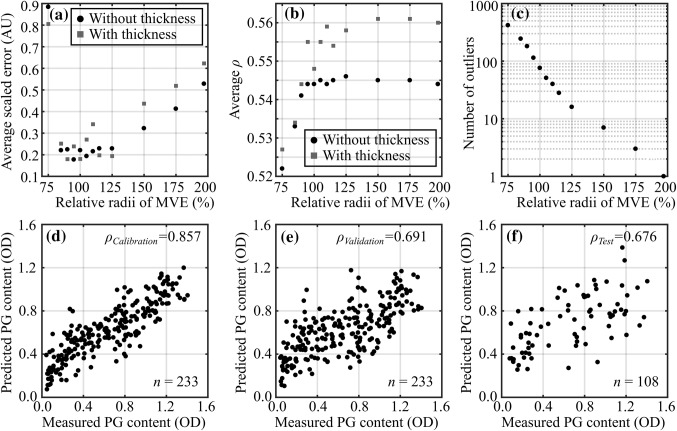
Figure 4.
Detection of outlier in vivo spectra was performed by calculating the minimum volume ellipsoid (MVE) of the first three principal scores of in vitro spectra. For cartilage reference properties, the average scaled root mean square error (RMSE, a), average Spearman’s rank correlation (ρ, b), and the number of outliers (c) are presented as a function of relative MVE radii with and without cartilage thickness. In addition, the relationships between measured and predicted full-thickness proteoglycan (PG) content (optical density, OD) for calibration (in vitro, d), validation (in vitro, e), and test (in vivo, f) sets are presented.

