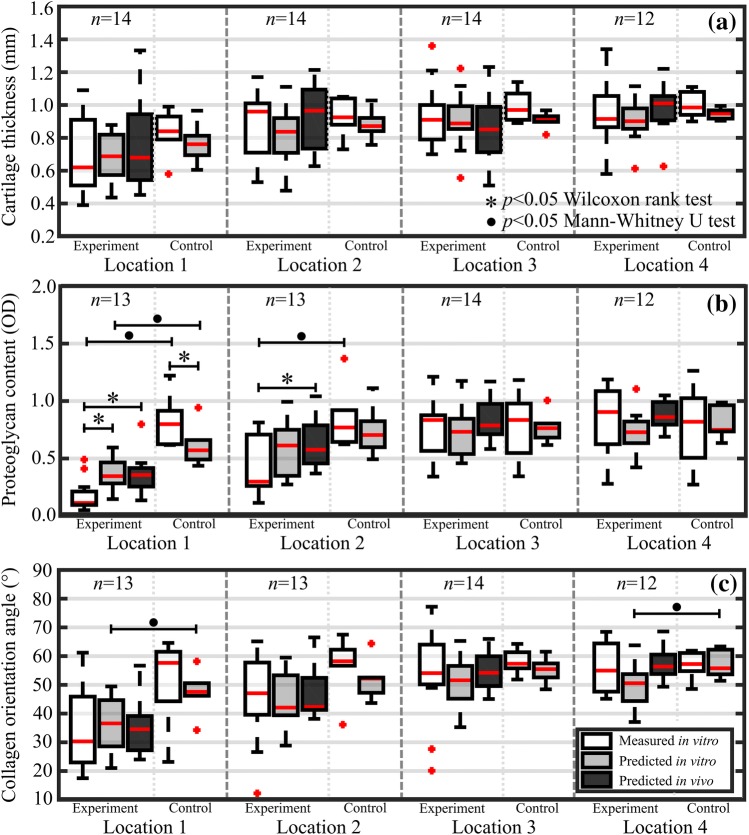
Figure 5.
Boxplots for experimental and control groups with median (red line), quartiles (25% and 75%), and outliers (red crosses) of in vitro measured (white bars), in vitro predicted (grey bars), and in vivo predicted (black bars) for the 4 distal locations at increasing distances from the lesion. Values are presented for cartilage thickness (a), full-thickness proteoglycan content (b), and full-thickness collagen orientation angle (c). For each location, experiment and control groups had 12–14 and 6 measurements, respectively.

