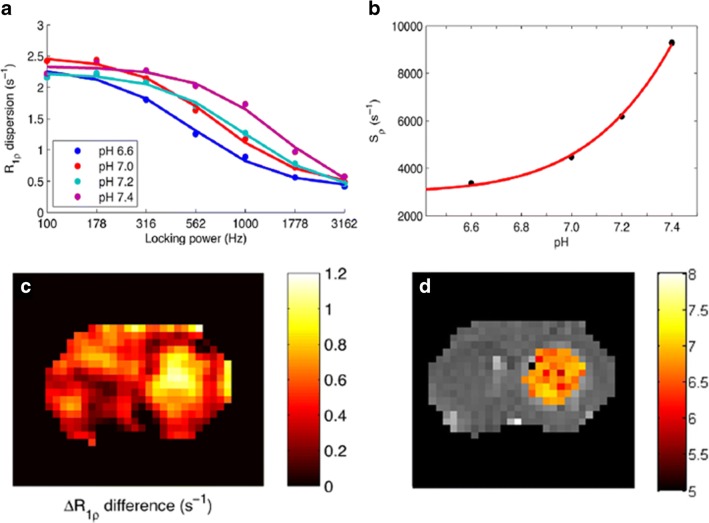
Fig. 10.
MRI-spin-lock imaging of tumor pH. Measured R1ρ dispersion curves for Iohexol at several pH values but constant agent concentration (a) and calibration curve for the fitted s0 parameter as a function of pH (b). ΔR1ρ difference map at 10 min after injection (c) and corresponding pH map from the tumor-bearing rat brain calculated as average of six ΔR1ρ difference maps at different time points after iohexol i.v. injection (d). Adapted with permission from Magnetic Resonance in Medicine 2018, 79, 298–305

