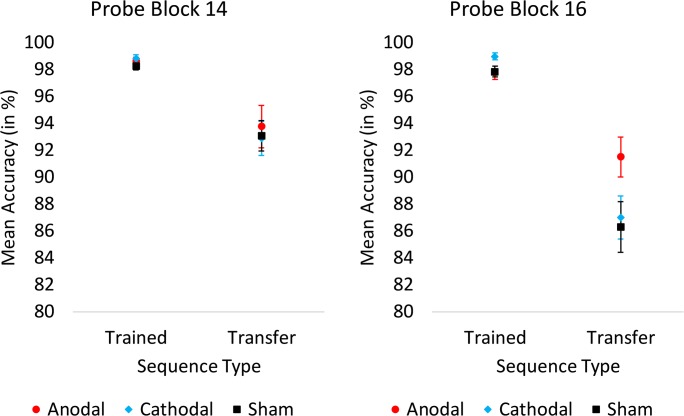
Fig. 4.
Mean accuracy (in percentage) as a function of stimulation group, sequence type, and probe block during test (at 24-h follow-up). Whereas there were no group differences in block 14, in block 16 there was selectively more accurate performance in the anodal stimulation group for the transfer sequence. Error bars represent standard error of the means

