
Fig. 1.
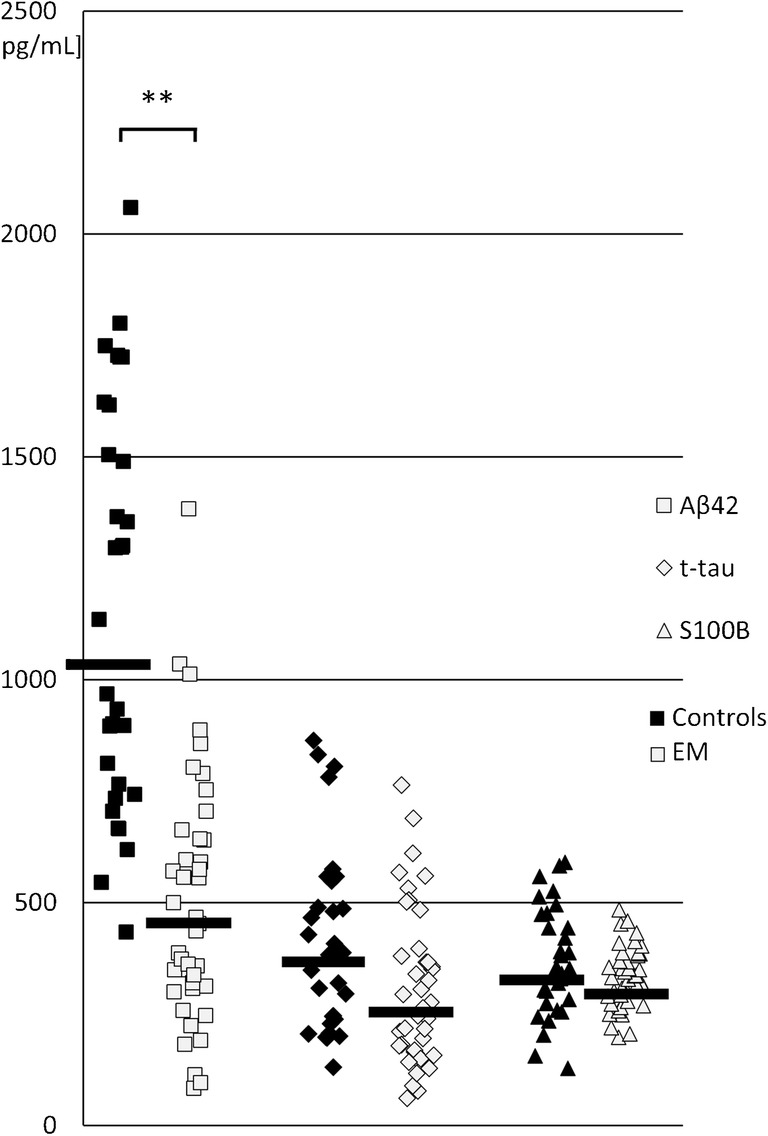
Scatter plot of cerebrospinal fluid concentrations of amyloid beta 42 (Aβ42, white square), total tau (t-tau, white diamond), and S100 calcium-binding protein B (S100B, white triangle) in enteroviral meningitis (EM) (white points) vs. controls (black points). Black horizontal lines represent median values. **p < 0.001