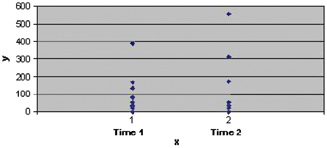
Figure 3.

Dynamic of TgA‐IgA levels in patients with type 1 diabetes. Legend: x=pacients at Time 1 (initially, when the patient was diagnosed with celiac disease) and Time 2 (finally, TgA‐IgA first monitoring after starting a gluten‐free diet); y=TgA‐IgA values (U/ml). Note the higher values of TgA‐IgA at a Time 2 (mean=128.9 U/ml) compared with TgA‐IgA values at Time 1 (mean=102.1 U/ml) and statistically significant differences (P=0.049<0.05) between those two times. *We want to mention that two patients had only the first value of TgA‐IgA because they were recently diagnosed; therefore, they are not in this chart.
