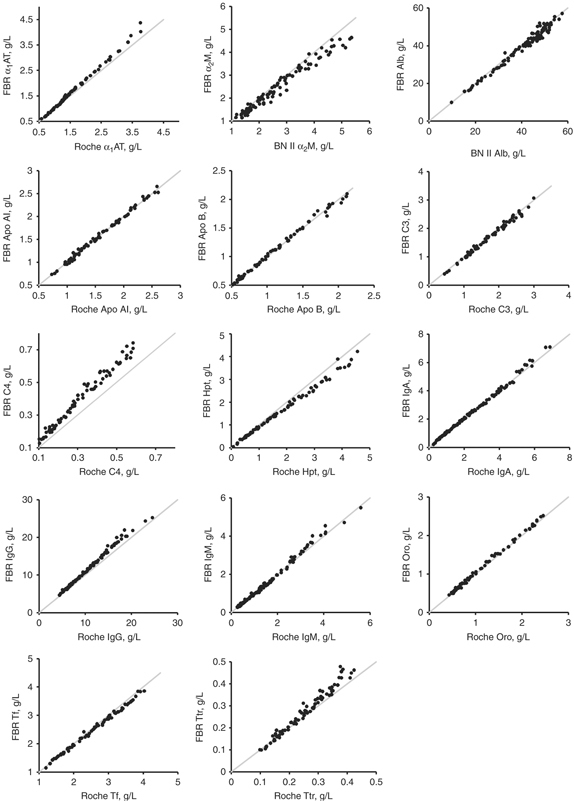
Figure 1.

Correlation plots for the method comparison studies between the test method (Foundation for Blood Research, FBR) and the reference method (either the Roche Tina‐quant® or the Siemens BN II). The solid line indicates the line of identity (x=y). Refer to Table 4 for the Deming regression statistics.
