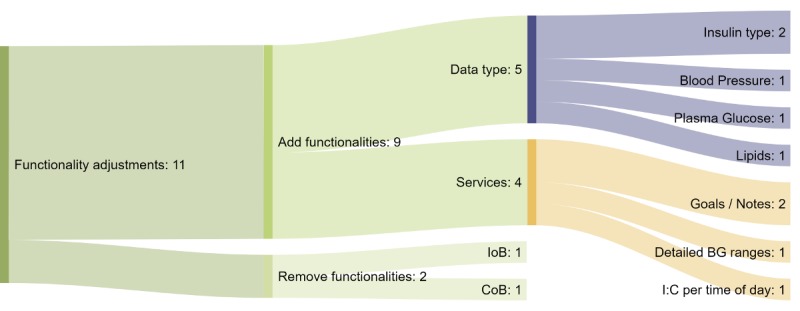
Figure 11.

Sankey diagram of the functionality adjustments proposed by the clinicians. Each color corresponds to a specific type of adjustment. Orange: new service; lilac: new data type; light green: remove functionality; green: add functionality; dark green: proposed functionality adjustment. The numbers represent the number of times an adjustment was mentioned. BG: blood glucose; IoB: insulin on board; CoB: carbohydrates on board; I:C: insulin to carbohydrate ratio.
