Figure 6.

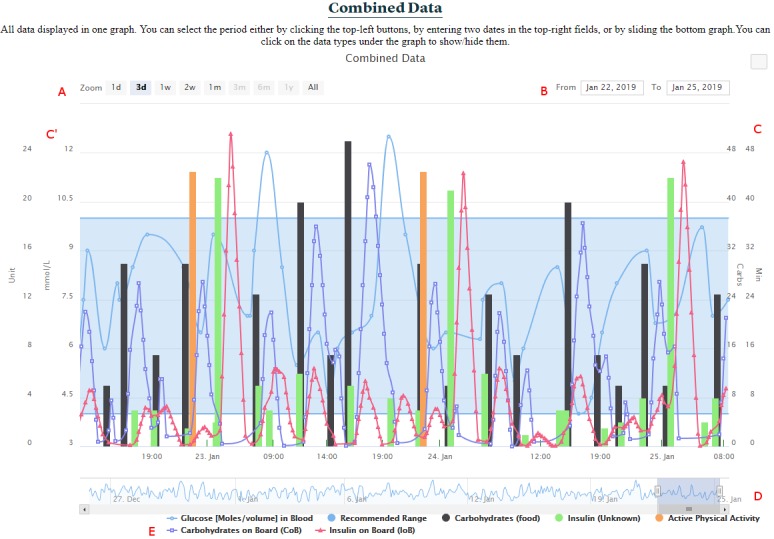
Combined data. (A) Period selection by predefined time length. (B) Period selection by dates. (C, C'): Multiple y-axes. (D) Period selection by range selector. (E) List of all data types represented in the graph.

Combined data. (A) Period selection by predefined time length. (B) Period selection by dates. (C, C'): Multiple y-axes. (D) Period selection by range selector. (E) List of all data types represented in the graph.