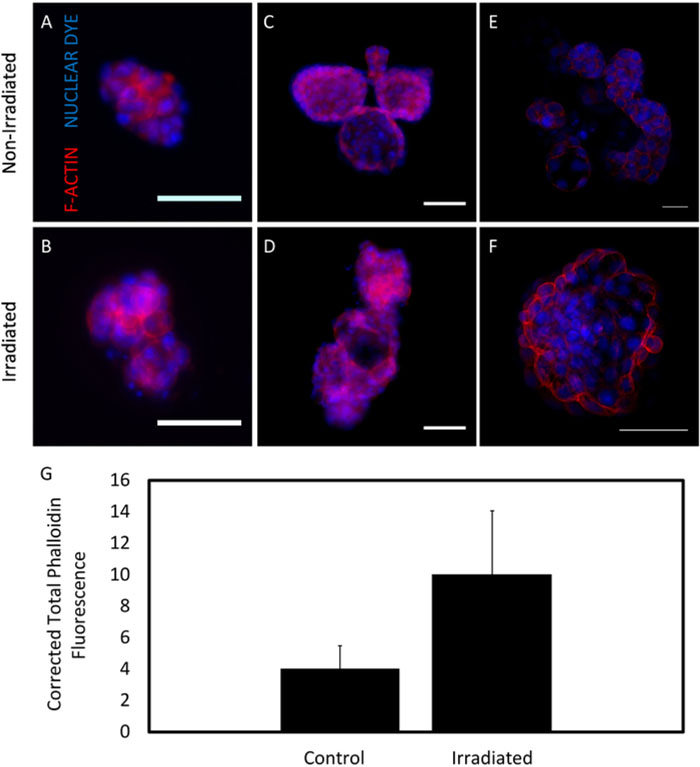
Figure 5. F-actin expression in organoids.
F-actin (red), a microfilament in epithelial cells, was expressed with lower intensity in non-irradiated organoids (A, C, E) than in irradiated (B, D, F) organoids. A nucleic acid stain was used to visualize nuclei (blue). Images were taken on low adhesion 96-well plates (A, B) and 16-well chamber slides (C, D). Images were also taken using confocal microscopy (E, F). All organoids were fixed and imaged after one week of growth. Scale bars are 50 μm. G. Phalloidin fluorescence data from low adhesion plate images were quantified in ImageJ (n = 3 glands). Error bars indicate standard error. Please click here to view a larger version of this figure.

