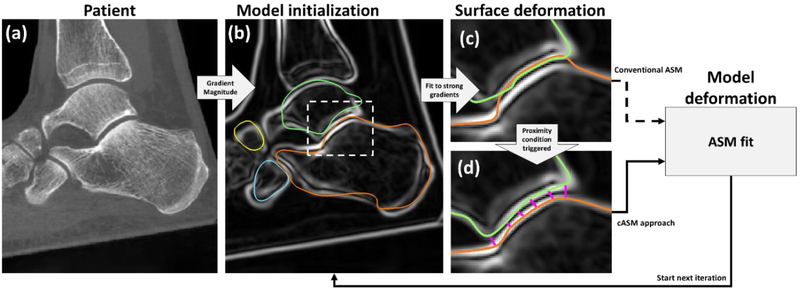
Figure 2.
Flowchart of ASM and the proposed cASM. (a) CBCT input image. (b) Gradient magnitude image of (a) with superimposed centroid-initialized initial mean bone shapes (orange: calcaneus, cyan: cuboid, yellow: navicular, green: talus). In (c), the mean shapes have been deformed along their normals to match local maxima of the gradient image. This aligned the calcaneus mesh with the articular surface of the talus. In conventional ASM, a new realization of the shape model would be computed using this erroneous gradient-matching surface. In cASM (d), the shape models of the bones are coupled by proximity constraints that act to push the gradient-matching surfaces apart inside the narrow joint space before a new realization of the ASM is estimated.

