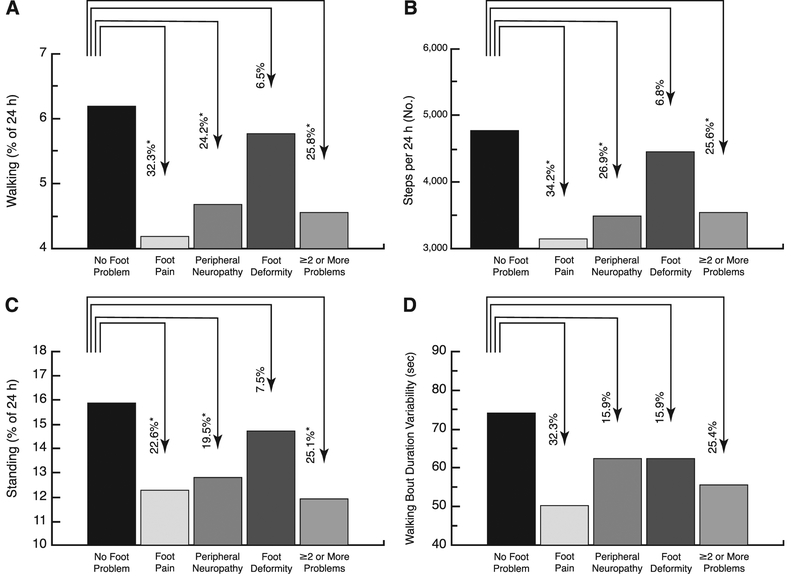
Figure 2.
Changes in spontaneous daily physical activities measured over 48 hours as a function of foot problems. Mean ± SE values per 24 hours are given for walking percent time (A), number of steps taken (B),standing percent time (C), and walking bout duration variability (D). The percentage change from the no foot problem value is indicated above each bar, which is not the absolute change for those measures whose unit is percentage of 24 hours. *P<.05.

