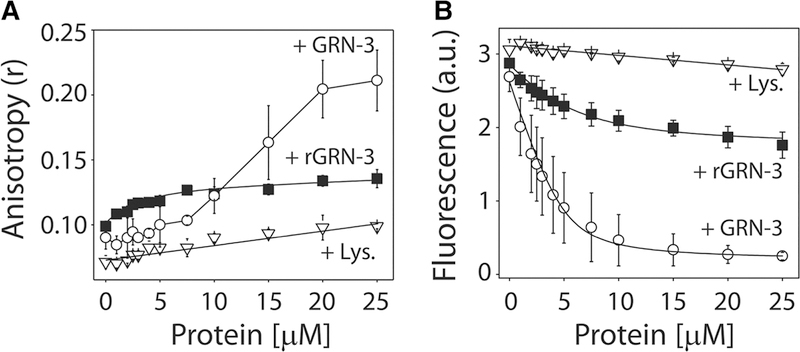
Figure 1. Binding interactions between GRN-3 and Aβ42.
(A) Changes in fluorescence anisotropy (r) of TMR-Aβ upon increasing concentrations of GRN-3 (○), rGRN-3(■), or BSA (∇; negative control). (B) Changes in the normalized intrinsic fluorescence intensities of TMR-Aβ, upon titration with increasing concentrations of GRN-3 (○), rGRN-3(■), or hen egg lysozyme (∇). The data were fit (black line) using a single ligand binding model as described in the Experimental section. The results represented are an average of n = 3 independent datasets.

