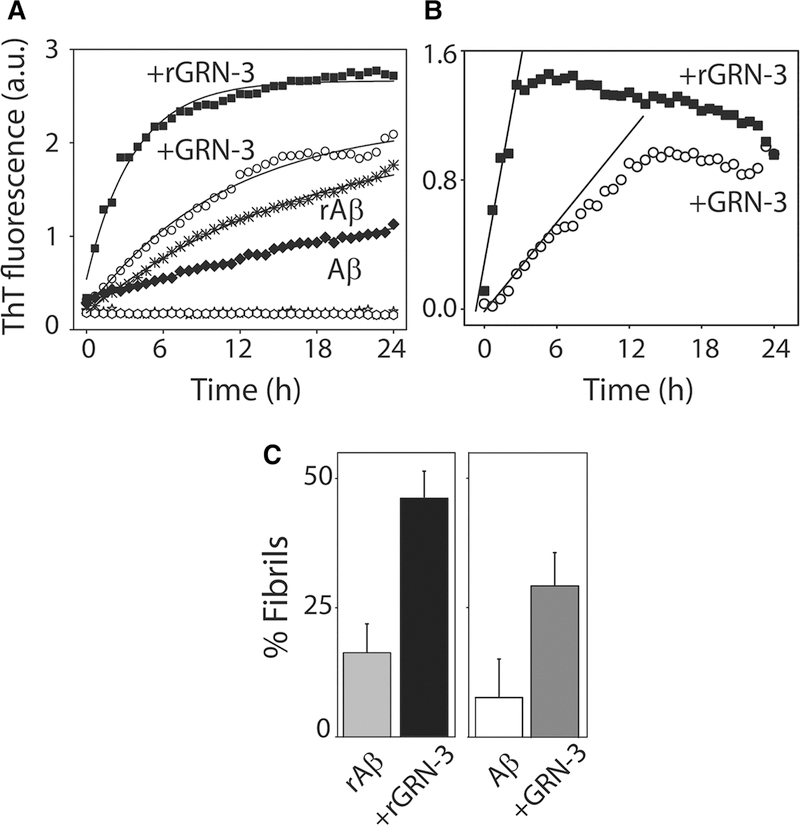
Figure 3. Aβ42 fibril formation induced by GRN-3 and rGRN-3.
(A) Aβ aggregation monitored by ThT fluorescence in the presence of rGRN-3 (■) or GRN-3 (○) with respective Aβ42 controls (Aβ42 + TCEP (rAβ); ⬡ and Aβ42 alone; ♦), and GRN-3 (○) or rGRN-3 (■) alone for 24 h. Briefly, 20 μM monomeric Aβ42 was incubated with 40 μM GRN-3 or rGRN-3 in a 1 : 2 stoichiometry. For the controls, 20 μM monomeric Aβ42 was incubated alone or in the presence of TCEP. (B) Net ThT kinetics of reactions from (A) with rGRN-3 (■) and GRN-3 (○) obtained by subtracting corresponding Aβ42 controls. The data were fit (black lines) using the initial rate method to obtain rate constants for the growth kinetics from the slope. (C) Quantification of the fibrils formed after 24 h in the presence or absence of GRN-3 or rGRN-3 determined via the relative difference between the ThT intensities of the samples and their respective supernatants obtained after centrifuging at 18 000×g for 20 min. The results represented are an average of n = 3 independent data sets.

