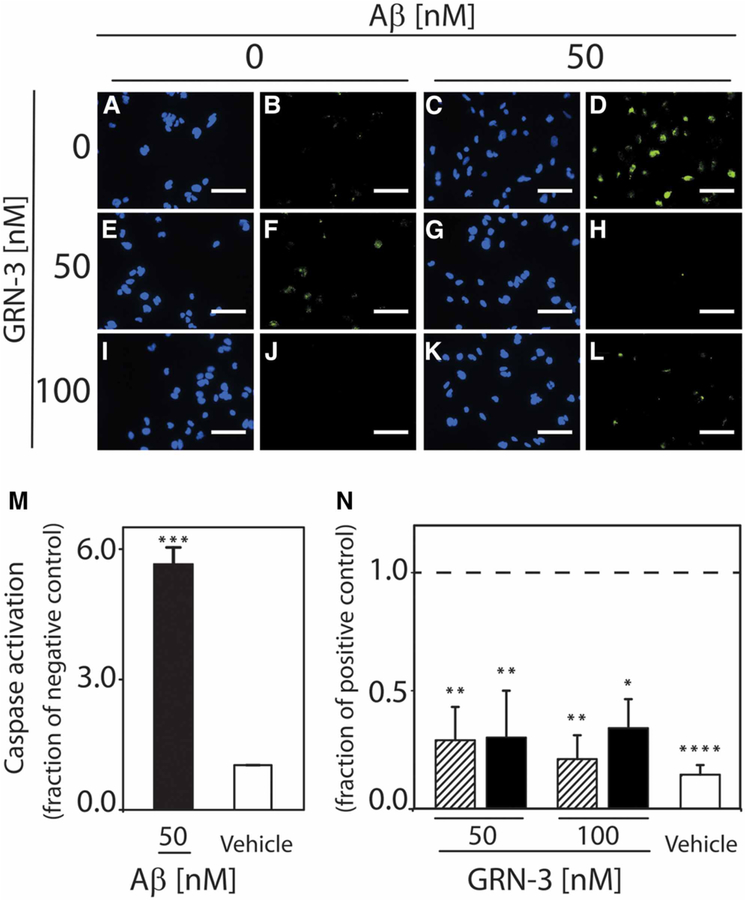
Figure 8. Direct interaction between GRN-3 and Aβ42 modulates Aβ-induced caspase activation.
SH-SY5Y human neuroblastoma cells were incubated for 24 h with the vehicle (A,B), 50 nM Aβ42 aggregated alone (C,D), 50 nM and 100 nM GRN-3 alone (E,F,I,J), and 50 nM Aβ42 aggregated in the presence of 50 nM GRN-3 (G,H) or 100 nM GRN-3 (K,L). To assess activation of caspases, cells were stained for nuclear markers (Hoechst 33342, blue) and activated forms of caspase-3 and −7 (FLICA, green) and imaged at 40×. Images are representative of three to four independent experiments. Scale bar indicates 50 μm. Image analysis was performed using a custom MATLAB subroutine to determine the percentage of caspase-active cells. (M) The percentage of caspase-active cells following treatment with 50 nM Aβ42 aggregated alone (black bar) or an equivalent dilution of buffer (vehicle, white bar) is shown normalized to the vehicle. ***P < 0.001. Error bars indicate SEM, n = 3–4. (N) The percentage of caspase-active cells following treatment with GRN-3 alone (lined bars) or with 50 nM Aβ42 aggregated in the presence of GRN-3 at a 1:1 or 2:1 molar ratio (GRN-3:Aβ42) (black bars) is shown normalized to the positive control (50 nM Aβ42 aggregated alone). The positive control is indicated by a dashed line at 1. *P < 0.05, **P < 0.01 Error bars indicate SEM, n = 3–4.

